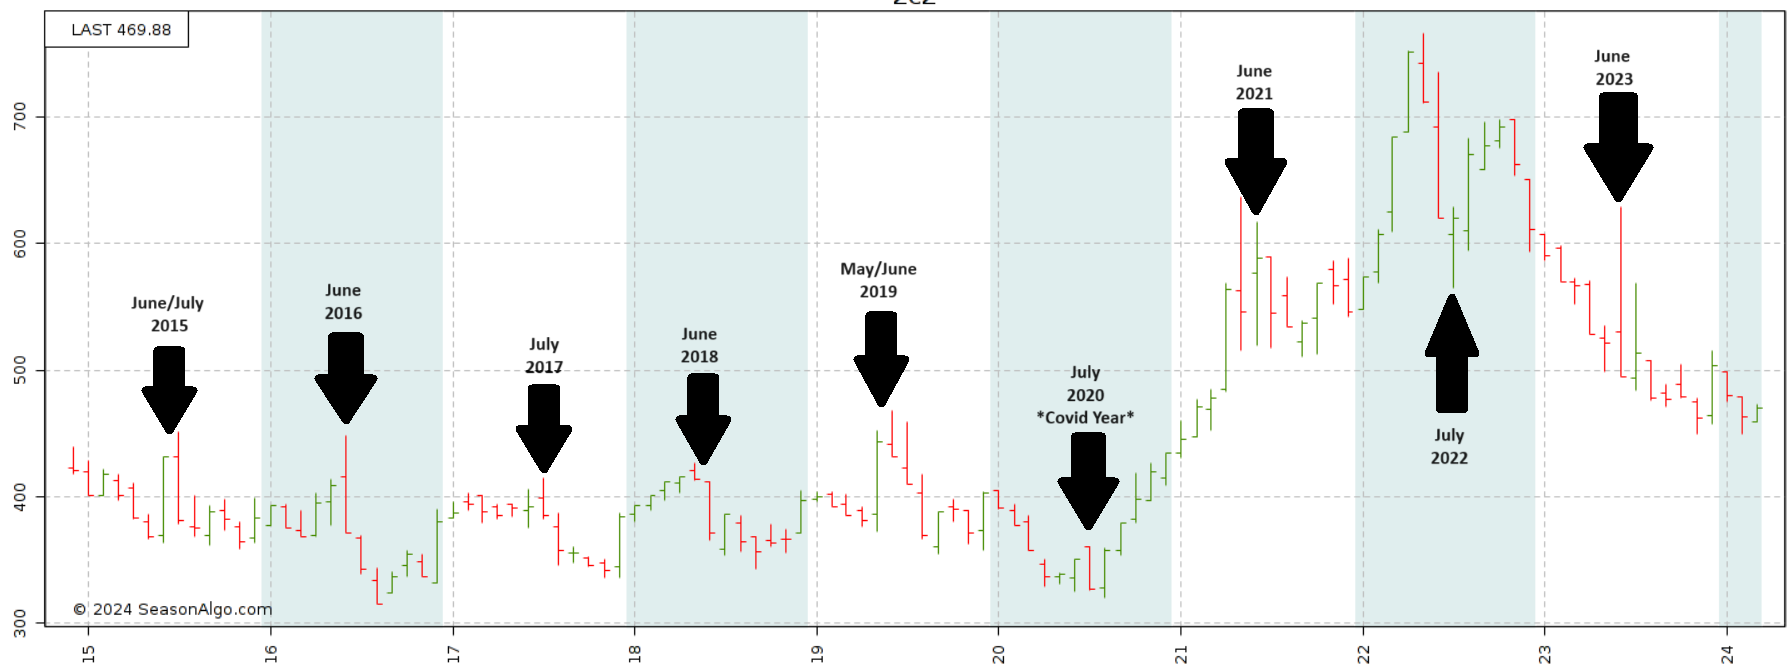
The CME Group CVOL corn index which measures volatility has recently climbed to its highest-level since September, which could be indicative of growing uncertainty about future prices which can be visualized in the chart below.

Get all of Blue Line Ag Hedge’s fundamental and technical research, alerts, recommendations, and more delivered to your inbox!
Sign Up Now!
Though volatility is multi-month highs, we’ve seen it continue to move higher into the spring and summer months for each of the last ten years. As you can see from the ten-year chart below, the rise in volatility typically aligns with the United States growing season with uncertainty surrounding everything that comes with it, from how many acres of what crop will be planted to weather conditions in various parts of the country during crop development.

Looking at a monthly price chart of the last 10 years we can see a few things, most notably that volatility tends to peak in the spring/summer months, as well as price. Of course, that is *trend is not guaranteed as a number of things can alter the course of volatility and price, such as the whole world shutting down, a war starting, or something different.

The bottom line is that volatility often times presents some great opportunity, particularly for producers as the uncertainty can add premium to prices. Having a plan in place ahead of time can help remove the FOMO (Fear Of Missing Out) that comes and goes with the peaks and troughs of the market. We think it’s important for producers to also remember that a good or a great price, will not always be the best price. Our team at Blue Line Ag Hedge specializes in helping clients devise plans and strategies that meet their needs, to help remove the emotion at decision making time.
Leave a Reply